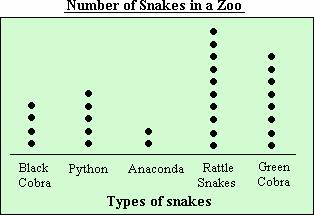
Friday, March 9, 2018

Data Representations

Image result for data
We have been learning about three new ways to represent data. We have learned about dot plots, frequency tables, and stem-and-leaf plots.

dot plot is a graphical display of data using dots. It is very similar to pictographs.
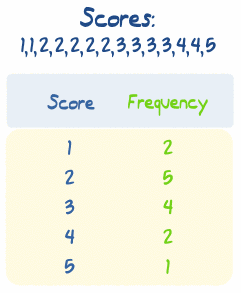

frequency table is a table that shows a set of numbers/scores and their frequency (how many times each one occurs).
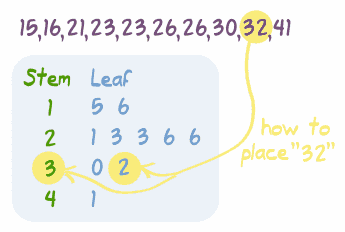
Frequency Distribution

stem-and-leaf plot is a plot where each data value is split into a "leaf" (usually the last digit) and a "stem" (the other digits). For example "32" is split into "3" (stem) and "2" (leaf). The "stem" values are listed down, and the "leaf" values are listed next to them. This way the "stem" groups the scores and each "leaf" indicates a score within that group.

Stem-and-Leaf Plot

Here are the basic steps to creating a stem-and-leaf plot:

Here are some videos about these data representations:


Here are some activities that you can do to practice these skills:


Please let me know if you have any questions!


Friday, March 2, 2018

Elapsed Time

Image result for elapsed time

We have just finished out our unit on measurement. This included calculating elapsed time. Elapsed time is the time that elapses while some event is occurring. We learned a few different strategies to calculate this, including using a number line, a t-chart, mountains, and zoom.

Number Line:

T-Chart:

Mountains, Hills, and Rocks:
Image result for elapsed time strategies
Zoom:
Image result for elapsed time strategies


Follow this link if you need a video refresher:
Elapsed Time Video

Here are some games to practice elapsed time:

RoboClock

Math Man

Elapsed Time Game

Elapsed Time

Please let me know if you have any questions!