Monday, December 18, 2017

Weather Instruments

There are many types of instruments used to measure and collect weather data. Some of the instruments we are learning about include thermometers, wind vanes, anemometer, barometer, rain gauge, and weather maps.

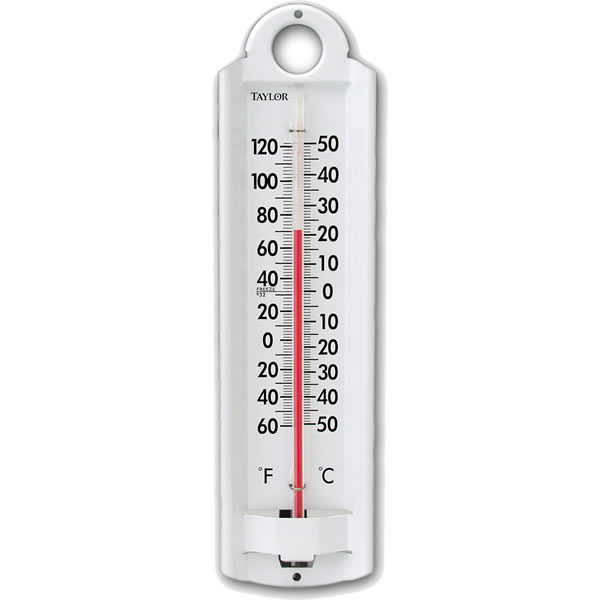
A THERMOMETER measures the air temperature. Most thermometers are closed glass tubes containing liquids such as alcohol or mercury. When air around the tube heats the liquid, the liquid expands and moves up the tube. A scale then shows what the actual temperature is.
A BAROMETER measures air pressure. It tells you whether or not the pressure is rising or falling. A rising barometer means sunny and dry conditions, while a falling barometer means stormy and wet conditions.
barometer

A RAIN GAUGE measures the amount of rain that has fallen over a specific time period.
rain-gauge

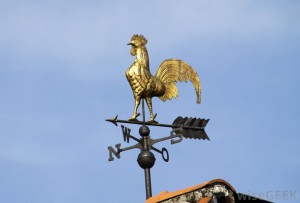
A WIND VANE is an instrument that determines the direction from which the wind is blowing.
wind-vane

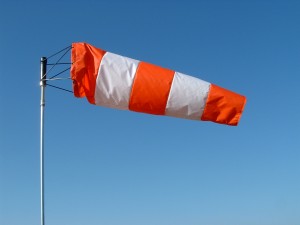
A WIND SOCK is a conical textile tube, which resembles a giant sock, designed to indicate wind direction and relative wind speed.
wind-sock

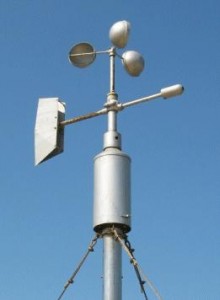
An ANEMOMETER measures wind speed. The cups catch the wind, turning a dial attached to the instrument. The dial shows the wind speed.
anemometer

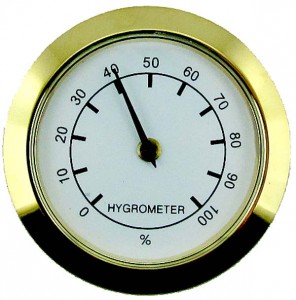
A HYGROMETER measures the water vapor content of air or the humidity.
hygrometer

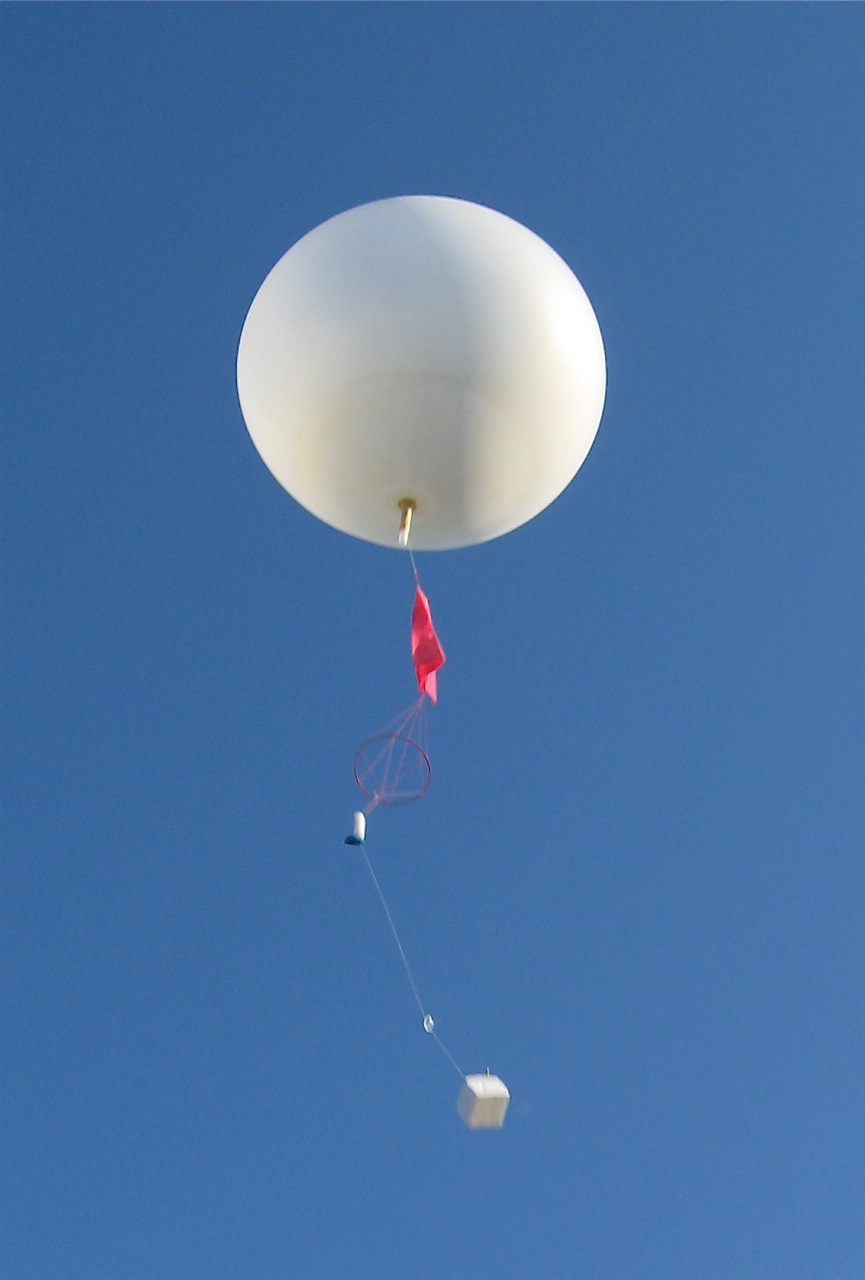
A WEATHER BALLOON measures weather conditions higher up in the atmosphere.

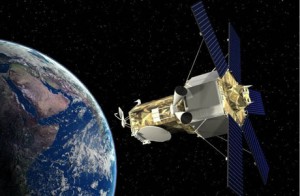
WEATHER SATELLITES are used to photograph and track large-scale air movements. Then meteorologists compile and analyze the data with the help of computers.
weather-satellite

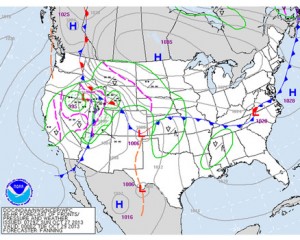
WEATHER MAPS indicate atmospheric conditions above a large portion of the Earth’s surface. Meteorologists use weather maps to forecast the weather.
weather-map

Here are some games related to this concept:


The Water Cycle

 Image result for the water cycle
The water cycle describes the existence and movement of water on, in, and above the Earth. Earth's water is always in movement and is always changing states, from liquid to vapor (gas) to ice (solid) and back again. The water cycle has been working for billions of years and all life on Earth depends on it continuing to work.

 Image result for the water cycle

The sun is what makes the water cycle work. The sun provides what almost everything on Earth needs to go—energy, or heat. Heat causes liquid and frozen water to evaporate into water vapor gas, which rises high in the sky to form clouds...clouds that move over the globe and drop rain and snow. This process is a large part of the water cycle.
Related image
The four parts of the water cycle that we study are precipitation, accumulation, evaporation, and condensation.
 Image result for the water cycle  
Precipitation is water released from clouds in the form of rain, freezing rain, sleet, snow, or hail. It is the primary connection in the water cycle that provides for the delivery of atmospheric water to the Earth. Most precipitation falls as rain.
Image result for precipitation in the water cycle

Accumulation, or collection is when water that falls from the clouds as rain, snow, hail or sleet, collects in the oceans, rivers, lakes, streams. Most will infiltrate (soak into) the ground and will collect as underground water. 
Image result for collection in the water cycle

Evaporation is the process by which water changes from a liquid to a gas or vapor. Evaporation is the primary pathway that water moves from the liquid state back into the water cycle as atmospheric water vapor.
Image result for evaporation in the water cycle


Condensation is the process by which water vapor in the air is changed into liquid water. Condensation is crucial to the water cycle because it is responsible for the formation of clouds. Condensation is the opposite of evaporation.

Image result for evaporation in the water cycle

Here are some games and websites that will help solidify our knowledge:


Fraction and Decimal Connections

Image result for fractions and decimals

We are working on the connections between fractions and decimals. Decimals and fractions represent the same thing: a number that is not exactly a whole number. To convert fractions to decimals, decimals need to have a 10 or 100 in the denominator. Then you just plug it into the correct place value.

              
Image result for fractions to decimals  


.5 = 5/10  <-- Hey, this guy reduces!
.5 = 5/10 = (5/10) / (5/5) = 1/2     So, .5 = 1/2

Image result for fractions decimals and money


Here are some games that will help practice this skill:

Model Decimals and Fractions

Matching Game

Puppy Chase

Please let me know if you have any questions.

Saturday, December 9, 2017

Equivalent Fractions


We are full swing into our unit on fractions. We are working on solidifying how to compose equivalent fractions. We have a few strategies for finding equivalent fractions (There are links to lessons underneath each strategy):


1. use fraction bars (These are hands on manipulatives that we use in class. I also have a paper copy if you would like a set to cut out and use at home.)

Image result for equivalent fractions with fraction bars


2. draw fraction strips (This is something that they can do to already existing pictures or they can draw themselves.)

Image result for equivalent fractions with fraction bars


3. use multiplication chart


3. multiply or divide numerator and denominator by 1 (3/3, 5/5, 10/10)


Here are some games that will help further these skills:

Equivalent Fractions PacMan

Equivalent Fractions Concentration

Remind your kiddo that in order for the fraction to be equivalent, what you do to the numerator MUST be done to the denominator as well. Please let me know if you have any questions!

Have a great week!

Friday, December 1, 2017

Fractions

Image result for fractions

A fraction is part of a whole.
Fraction
• the top number (the numerator) says how many parts we have

• the bottom number (the denominator) says how many parts the whole is divided into


Slice a pizza, and you will have fractions:

                   
            1/2                             1/4                             3/8
      (One-Half)                    (One-Quarter)                  (Three-Eighths)

The top number tells how many slices you have. 
The bottom number tells how many slices the pizza was cut into.

Watch this video for an introduction to fractions: 

Here are some games to play that will solidify this concept:

Fraction Pictures

Make 1 with Fractions

Alien Fraction Sort

Interactive Fraction Bars

Matching Fractions Parts of a Set

Fraction Splat

Fraction Splat Match

Please let me know if you have any questions!

Natural Resources

Related image

Natural Resources exist freely in nature. These things include water (seas and fresh water), land, soils, rocks, forests (vegetation), animals (including fish), fossil fuels and minerals. They are the basis of life on earth.

All these mentioned above are natural, and they exist in nature. No human created them. We tap into their supply to survive and also to function properly. Natural resources are all connected in a way. Therefore if one is taken away, it will affect the supply or quality of all others. For example, if water is eliminated from an area, the vegetation, soils, animals and even the air in that area will be affected negatively.

Here are some great things we get from natural resources:


Natural resources are broken down into two categories according to their production, renewable and nonrenewable.

Image result for natural resources

Renewable resources can be replaced and replenished in our lifetime. Some examples are sun, wind, water, soil, and plants. 

Nonrenewable resources cannot be replaced in our lifetime. They do not renew quickly.Some examples are coal, oil, diamond, fossil fuels.


Image result for natural resources

Image result for natural resources

Here are some videos that further explain these differences:


Here are some games to help further your knowledge:


Monday, November 13, 2017

Input-Output Tables

Picture

Input and output tables are diagrams used to teach the basic concepts of functions. They are based on the rule of the function. When the table is filled in, it produces the pairs of coordinates that are necessary to construct the graph. The input is the value of x that is applied to the function. The output is the f(x), or the answer that is received as a result of putting x into the function.


Image result for input/output tables

Here is a link to a clear explanation with examples.

Input/Output Table Lesson

Here are some games for additional practice:

Function Tables

Function Machine

Stop that Creature Game

Find the Rule

Please let me know if you have any questions!


Weathering, Erosion, and Deposition


Related image

We are studying the slow changes to the Earth's surface. These processes include weathering, erosion, and deposition.
Related image

Weathering is the process of natural forces breaking down rocks into smaller pieces. Some of the causes of weathering include: moving water, ice, wind, plant root growth, burrowing animals, and temperature changes.

Image result for weathering

Erosion is the process which the broken pieces are transported, or moved, from one place to another. Some of the causes of erosion include: moving water, wind, glaciers (ice), and gravity (avalanches).

Image result for erosion

Image result for weathering erosion and deposition

Deposition is the process of moved particles being deposited, or dropped off, in a new location. This process creates new land forms such as flood plains, deltas, sand dunes, and beaches.

Related image

Although we talk about weathering, erosion, and deposition as three separate processes, they often occur together. Over time, rocks are generally broken into smaller pieces (weathering), carried downhill (erosion), and deposited in a new location (deposition).
Image result for weathering erosion and deposition

Image result for weathering erosion and deposition
Here are some games to help further your understanding of WED:

WED Jeopardy

Shape It Up

Ask your kiddo about our extreme WED Simon Says or how we showed WED using Legos!