Monday, April 23, 2018

Measuring Angles with Protractors

We are finishing out our geometry unit by using protractors to determine the measurement of angles. We have really been having fun with protractors!


Image result for using a protractor

Here is a website that will walk you through the steps if you need a refresher: 

Kiddos will also need to be able to determine the degree without having a ray line up with the zero line. To do this, you need to skip count from one ray to the other to see the rotation degree. You can also subtract the degrees of the rays from each other (165-40=125 degrees or 140-15=125 degrees). When you are subtracting the degrees you need to be sure to use both outside numbers on the protractor or both inside numbers on the protractor. The angle below would measure at about 125 degrees.

Image result for steps to using a protractor

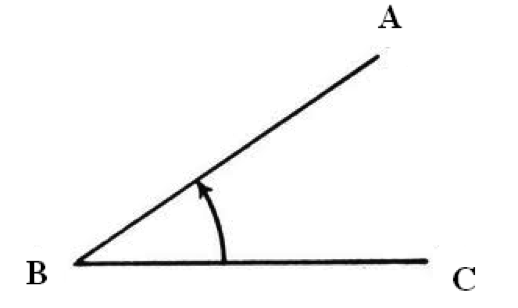
They will also need to be able to draw an angle using a protractor.

Image result for draw an angle using protractorImage result for draw an angle using protractor

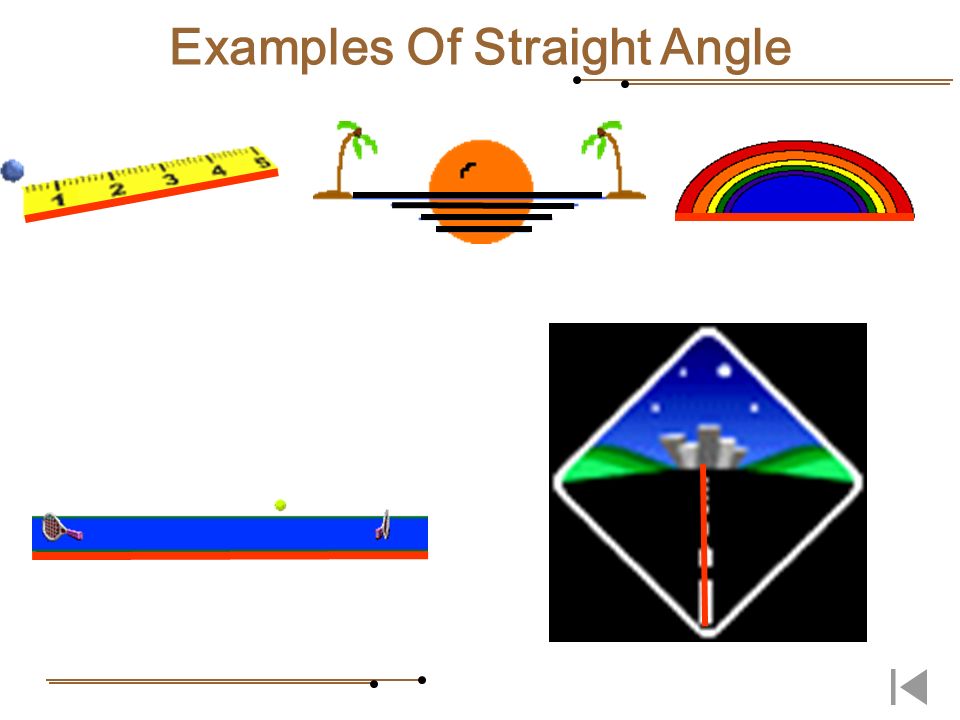
Finding the missing angle is also a concept we have worked on. Angle COA is a straight angle and therefore measures 180 degrees. We know that angle BOA measures 44 degrees. We can subtract the known angle from the large angle to determine the missing angle (180 - 44 = 136). Angle COB would measure 136 degrees.

Image result for missing angle in adjacent angles

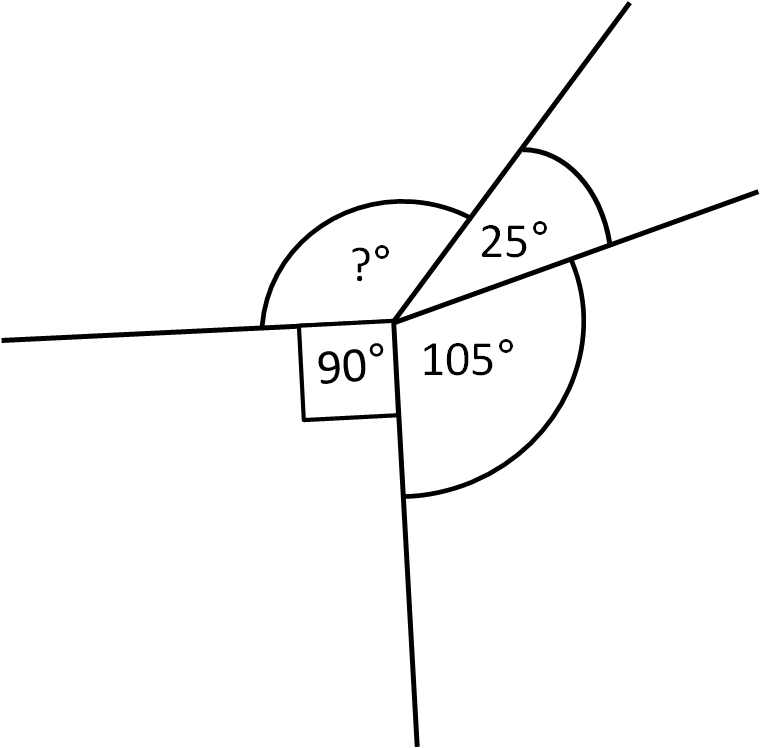
The angles below create a complete circle which measures 360 degrees. To find the missing measure, we need to add the given degrees (25 + 90 + 105 = 220) and subtract it from our total (360-220 = 140). This gives us the missing measure of 140 degrees.
Image result for missing angle

Here are some games where kiddos can practice using a protractor:


Please let me know if you have any questions!

Monday, April 2, 2018

Life Cycles

Image result for life cycle

A life cycle is the sequential stages of growth and development that an organism goes through in its lifetime. Organisms undergo observable changes during their life cycle including birth, growth, development, reproduction, and death. Some animals, such as butterflies and beetles, pass through distinctly different life stages during their life cycle. Some plants, such as radishes and lima beans, develop from seeds into small plants that resemble the adult form.

Life Cycle of a plant:

Diagram of Life Cycle of a Plant
The plant starts life as a seed, which germinates and grows into a plant. The mature plant produces flowers, which are fertilized and produce seeds in a fruit or seedpod. The plant eventually dies, leaving seeds which germinate to produce new plants.

Life cycle of a beetle:

Image result for life cycle of a beetle
The life cycle of a beetle is known as a complete metamorphosis, meaning it has four very different stages: egg, larval, pupal and adult.

Here are some games to solidify these concepts:

Life Cycles Games

Interactive Sites

Life Cycle of Plants

Butterfly Life Cycle

Classifying Quadrilaterals and Triangles

We have been studying different geometric figures. Our main focus has been on classifying quadrilaterals and triangles.

quadrilateral is a four-sided polygon with four angles. There are many kinds of quadrilaterals. The five most common types are the parallelogram, the rectangle, the square, the trapezoid, and the rhombus.


Here is how they relate to each other:


We have been looking at triangles based on their angles.

The right triangle has one 90 degree angle and two acute (< 90 degree) angles.
Image result for triangles by angles

Obtuse triangles have one angle that is greater than 90 degrees. Obtuse triangles have only one obtuse angle.

Acute triangles have NO angles greater than or equal to 90 degrees -- all their angles are less than 90 degrees. Acute triangles have three acute angles.
Image result for acute triangle

Ask your kiddo if they can find these different quadrilaterals and triangles in the world around them.

Lines, Rays, and Angles

Our geometry unit is in full swing! Here are some of the vocabulary terms that we use.

point is an exact position on a plane surface.


line is a collection of points along a straight path with no end points. 


line segment is a part of a line that contains every point on the line between its end points. 


ray is a line with a single end point that goes on and on in one direction.


Parallel Lines are two lines that remain the same distance apart at all times and never intersect.


Perpendicular Lines are two lines that intersect and from right angles. 


Intersecting Lines meet or cross each other.


A figure is symmetric (or has symmetry) if it can be folded on a line to form two equal (congruent) halves that fit on top of each other.

Image result for symmetryImage result for symmetry

Line of symmetry is the fold line of a symmetrical figure. A figure can have one, many, or no lines of symmetry.

Image result for symmetry

Related image

An  angle is the intersection of two rays with a common vertex or endpoint. An angle measures the amount of turn of the rays.


There are four types of angles that we have learned about.

An acute angle is an angle whose measure is less than 90°.

Image result for acute angle Image result for acute angle

right angle is an angle whose measure is 90°.

Image result for right angle Image result for right angle

An obtuse angle is an angle whose measure is more than 90°, but less than 180°.

Image result for obtuse angle  Image result for obtuse angle

straight angle is an angle whose measure is 180°.

Image result for straight angle Image result for straight angle

Remember that an angle is named using three letters, where the middle letter corresponds to the vertex of the angle.  The angle below is ∠ABC or ∠CBA.   If it is perfectly clear which angle is being named, an angle may be referred to by its vertex letter alone, such as B.

Image result for angle ABC

Here are a couple of fun website that allows you to play around with angles:

Angles

Name that Angle

Check out our angle song:

Angle Song

Watch this video to get a better understanding of the differences between these geometry terms.

Geometry Terms

Here are some ways to practice the geometry terms:

Geometry Term Practice

Lines, line segments, and rays practice

Ask your kiddo to show you the dance moves we came up with for these terms.

Heredity


Related image

Heredity is the passing of genetic traits from parent to offspring. This is done through dominant and recessive genes.

Dominant genes are the strongest and are usually labeled with a capital letter - "B" for brown, for instance.

Recessive genes are typically hidden by dominant genes. Label the recessive gene for blue eyes "b" - lowercase.

If you get two dominant genes for eye color - BB - you're a brown-eyed beauty. Inherit a dominant and a recessive gene - Bb - you get the dominant color: brown. When both parents contribute a recessive gene, in this case blue-blue or bb, you've got blue eyes. These examples are all inherited traits.

Related image Related image Image result for dominant and recessive traits

Inherited traits are characteristics that are determined by an organism’s genetics and passed from parent to offspring. This can include eye color, hair color, skin type, height, etc.

Acquired traits, or learned behaviors, are behaviors that are acquired by an organism’s interactions with its environment and /or parents. This can include riding a bike, swimming, drawing, climbing, etc.

Inherited behaviors are behaviors that are instinctive. This includes breathing, smiling, blinking, etc.

Check out this fun game to test your knowledge:

Adaptations, Inherited Traits, Learned Behaviors and Food Chains Jeopardy

Friday, March 9, 2018

Data Representations

Image result for data
We have been learning about three new ways to represent data. We have learned about dot plots, frequency tables, and stem-and-leaf plots.

dot plot is a graphical display of data using dots. It is very similar to pictographs.


frequency table is a table that shows a set of numbers/scores and their frequency (how many times each one occurs).

Frequency Distribution

stem-and-leaf plot is a plot where each data value is split into a "leaf" (usually the last digit) and a "stem" (the other digits). For example "32" is split into "3" (stem) and "2" (leaf). The "stem" values are listed down, and the "leaf" values are listed next to them. This way the "stem" groups the scores and each "leaf" indicates a score within that group.

Stem-and-Leaf Plot

Here are the basic steps to creating a stem-and-leaf plot:

Here are some videos about these data representations:


Here are some activities that you can do to practice these skills:


Please let me know if you have any questions!


Friday, March 2, 2018

Elapsed Time

Image result for elapsed time

We have just finished out our unit on measurement. This included calculating elapsed time. Elapsed time is the time that elapses while some event is occurring. We learned a few different strategies to calculate this, including using a number line, a t-chart, mountains, and zoom.

Number Line:

T-Chart:

Mountains, Hills, and Rocks:
Image result for elapsed time strategies
Zoom:
Image result for elapsed time strategies


Follow this link if you need a video refresher:
Elapsed Time Video

Here are some games to practice elapsed time:

RoboClock

Math Man

Elapsed Time Game

Elapsed Time

Please let me know if you have any questions!